


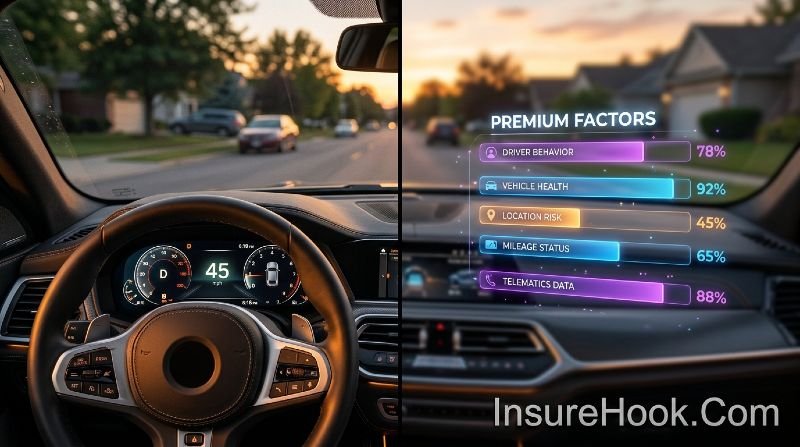
Car insurance pricing feels like a black box to most people. You fill out a form, get a number and wonder why your neighbor pays less for the same coverage. The answer lies in how insurers actually build your rate from the ground up.
This is not a simple formula. It is a layered risk assessment that pulls from your personal data, your vehicle, your location and your behavior. Understanding each layer helps you make smarter decisions about coverage, shopping and what you can realistically change.
How Insurers Think About Risk
Every premium starts with one question: how likely is this person to file a claim, and how expensive will that claim be?
Actuaries answer that question using decades of historical claims data. They identify patterns across millions of policyholders and build statistical models that predict future losses. Your premium is where you land inside that model.
The goal for the insurer is to collect enough across all policyholders to cover expected claims and operating costs while remaining financially stable. You are not priced as an individual. You are priced as a member of multiple overlapping risk groups.
That is why two drivers with identical vehicles can get wildly different quotes from the same company.
The Factors That Drive Your Premium
Driving Record Carries the Most Weight
Your history behind the wheel is the single strongest signal insurers use. At-fault accidents tell the model you have already caused a loss. Moving violations suggest you take risks that lead to accidents.
A single at-fault accident typically raises a premium between 20 and 45 percent depending on the severity and the insurer. A DUI conviction is treated far more harshly. Many carriers move drivers to a nonstandard tier or decline renewal entirely after a serious conviction.
The practical reality is that most violations age out of your rating window after three to five years. A sustained clean record does bring rates back down. Patience and clean driving are the most reliable path to lower rates after a serious incident.

Age Reflects Statistical Risk
Younger drivers file more claims per mile driven than any other age group. This is not a stereotype. It is a consistent finding across all major insurance markets. The cost of adding a teen driver to a policy reflects exactly this elevated risk profile.
Rates typically peak in the late teens and improve steadily through the mid-twenties. Most drivers reach their most favorable rate tier somewhere in their thirties and forties. Some insurers apply modest surcharges for drivers beyond age 70 though this varies by state and company.
Your Vehicle Affects More Than Just Collision Coverage
Insurers do not just look at what your car is worth. They look at how much it costs to repair, how often that model gets stolen and how frequently it appears in serious injury claims.
A luxury SUV with proprietary sensors in every bumper costs substantially more to repair after a minor collision than a standard sedan. A high-performance sports car sits in a different actuarial bucket than a family minivan even if the purchase price is similar.
Safety ratings from the Insurance Institute for Highway Safety and the National Highway Traffic Safety Administration feed directly into the risk model. Vehicles with strong crash test performance and advanced safety systems often qualify for lower physical damage rates.
Location Pricing Goes Deeper Than You Expect
Your ZIP code tells the insurer a lot. Claims frequency in your area, local weather patterns, vehicle theft rates and the average cost of auto repair labor all factor into your territorial rating.
Urban drivers consistently pay more than rural drivers in the same state. Dense traffic means more fender-benders. Higher theft rates mean more comprehensive claims. More expensive repair shops mean higher payouts per claim.
What surprises most people is how granular this gets. Some insurers now use block-level claims data in certain markets rather than broad ZIP code territories. The difference between two addresses a mile apart can produce a measurable rate difference.
State laws also shape what coverage you are required to carry. Minimum coverage requirements vary significantly across states and establish the floor for what your policy must include.
Credit-Based Insurance Scores Matter in Most States
Most states allow insurers to use a credit-based insurance score as a pricing factor. This is not your lending credit score. It pulls from similar data but is specifically calibrated to predict insurance claims rather than loan repayment behavior.
The statistical correlation between credit-based scores and claims frequency is well-documented. Insurers defend its use as a legitimate predictor of risk. Critics argue it creates pricing inequity for lower-income drivers.
California, Hawaii and Massachusetts prohibit its use in auto insurance pricing entirely. Michigan added significant restrictions in recent years. If you live in a state that allows it, a meaningful improvement in your credit profile can translate directly into lower premiums at renewal.
Most drivers focus entirely on their driving record when they think about their premium. But in states that allow credit scoring, I have seen credit improvements produce rate reductions that rival years of clean driving. It is genuinely one of the most overlooked levers available to policyholders.

Annual Mileage and How You Drive
Annual mileage affects your rate because more time on the road means more exposure to accidents. Insurers ask for estimated mileage during the application process. Low-mileage drivers typically qualify for discounts.
The bigger shift in 2026 is telematics. Many insurers now offer programs where you allow an app or plug-in device to monitor your actual driving behavior. Smooth braking, steady speeds and minimal late-night driving can earn meaningful discounts. Aggressive driving patterns can result in surcharges after the monitoring period.
Drivers who have dramatically reduced their commute or switched to remote work should ensure their insurer has accurate mileage on record. Mileage-based pricing through pay-per-mile insurance is also worth exploring for genuinely low-mileage drivers.
Coverage Choices Are the Most Controllable Factor
The coverage you select has a direct and predictable effect on your premium. Higher liability limits cost more. Adding comprehensive and collision coverage adds significantly more. Your deductible level creates an immediate pricing difference.
Choosing a $1,000 deductible instead of a $250 deductible on collision coverage can reduce that portion of your premium noticeably. You absorb more cost after a claim but the insurer’s exposure shrinks and your rate reflects that.
Understanding exactly what each coverage type pays for matters before you make these decisions. The breakdown of collision vs. comprehensive coverage clarifies what you are actually buying with each option.
How All These Factors Stack Together
No single factor operates in isolation. Insurers apply multipliers across variables simultaneously. A 19-year-old with one at-fault accident driving a sports car in a dense urban ZIP code is compounding risk across four separate dimensions at once. Each layer amplifies the others.
The table below shows the relative influence of common rating factors. Exact weights vary by insurer and by state.
| Rating Factor | Relative Influence |
|---|---|
| Driving record (accidents and violations) | Very High |
| Age and driving experience | High |
| Vehicle make, model and trim level | High |
| Geographic location and territory | High |
| Coverage selections and deductible level | High |
| Credit-based insurance score | Moderate to High |
| Annual mileage | Moderate |
| Telematics and driving behavior data | Moderate |
| Marital status | Low to Moderate |
| Anti-theft features and safety equipment | Low |
| Continuous coverage history | Low |
This framework reflects general industry practice. Individual carriers assign their own weights. Some specialize in high-risk drivers and price accordingly. Others compete most aggressively for low-mileage, high-credit suburban profiles. That difference in target market is the main reason identical drivers receive very different quotes.
What Shifted in 2026
The auto insurance market went through significant stress between 2022 and 2024. Repair costs surged. Supply chain disruptions made parts expensive and hard to source. Medical costs tied to injury claims rose sharply. Several major insurers posted significant underwriting losses and responded with substantial rate increases across most states.
By 2026, the market has partially stabilized but premiums remain elevated compared to pre-2022 levels. A few specific developments shape how rates are being built right now.
Telematics adoption has accelerated dramatically. Programs that were opt-in novelties a few years ago are now mainstream offerings across most major carriers. The data collected through these programs is becoming a more significant pricing factor for participating drivers.
Usage-based insurance is growing as a distinct product category. Some carriers now offer policies priced almost entirely on driving behavior and mileage rather than traditional demographic factors.
Repair cost inflation is still baked into pricing in most markets. Even drivers with clean records in low-risk locations are paying more than they would have for identical coverage in 2021. This is a market condition rather than anything related to individual risk.
Several states have also updated their regulations around how insurers can use territory and demographic data in pricing. The National Association of Insurance Commissioners continues to publish guidance that state regulators adapt differently. If you want to understand how federal and state oversight interacts in insurance pricing, the NAIC resource center provides reliable background.
A Real Scenario That Shows How This Works
Marcus is 34 years old with a clean driving record and drives a 2021 Honda Accord. He relocated from suburban Columbus, Ohio to downtown Chicago for a new job. His annual mileage stayed roughly the same. His vehicle did not change. His driving record did not change.
His renewal came in 38 percent higher than the prior year.
The explanation was entirely location. His new ZIP code placed him in a territory with higher claims frequency, higher theft rates and higher average repair costs. His insurer recalculated his territorial rating and his premium moved accordingly. Marcus had not done anything that increased his personal risk. His location did it for him.

This outcome catches people off guard. It should not once you understand that location is one of the highest-weighted factors in the pricing model.
What You Can Actually Change
Some rating factors are fixed. Your age is your age. Your driving history is already written. Your location is often tied to work or family.
But several inputs are genuinely adjustable and can produce real premium movement.
Your deductible level on physical damage coverages is the most immediate lever. Raising your deductible from $250 to $1,000 reduces the insurer’s exposure on collision and comprehensive claims and lowers your premium.
Participating in a telematics program makes sense if your driving habits are clean. Smooth, predictable driving during the monitoring period typically earns a discount that persists through subsequent renewals.
Shopping competing quotes is the single highest-impact move for many drivers. Pricing models differ enough between carriers that the same driver can see a 30 to 40 percent rate difference between two legitimate insurers. The factors behind premium calculation are the same but the weights each company assigns are proprietary.
Improving your credit-based score over time matters in states that allow its use. Paying down revolving debt and resolving negative items on your credit report can shift your insurance risk tier at renewal.
Bundling your auto policy with a renters or homeowners policy from the same insurer typically produces a multi-policy discount. This does not change your risk profile but it does reduce what you pay.
Finally, ask your insurer specifically which discounts you currently receive and which ones you do not. Many qualifying discounts go unclaimed simply because no one asked.
Your Premium Impact Estimator
See which factors likely affect your rate most
Why Identical Drivers Get Different Quotes
This is the question that trips people up most often. If the rating factors are the same across the industry, why do premiums vary so much between companies?
Each insurer builds its own version of the pricing model. They assign different weights to each factor. They target different customer profiles. One carrier may price most aggressively for older drivers with long tenure at the company. Another may compete hardest for young urban drivers with telematics data.
A carrier’s recent claims experience also influences pricing. If a company has taken heavy losses in a particular state or vehicle category, it raises rates to restore financial balance. That decision reflects the insurer’s portfolio, not your individual record.
State regulators must approve rate changes, which means pricing shifts do not happen overnight. The Consumer Financial Protection Bureau and state insurance departments provide additional oversight relevant to how credit data is used in pricing decisions.
This is why shopping your policy periodically is a genuinely useful practice. The company that was most competitive for your profile three years ago may not be today.

Frequently Asked Questions
Not exactly. Insurers use a credit-based insurance score that draws from similar data but is calibrated specifically to predict claims rather than loan repayment. In most states this score influences your rate. California, Hawaii and Massachusetts prohibit its use in auto insurance pricing.
Yes. Insurers can and do adjust rates based on broader factors like rising repair costs in your territory, increased claims frequency in your ZIP code or changes in their own financial position. Your individual record is one factor in the model, not the only one.
No. Vehicle color is not a rating factor. Make, model, trim level, safety ratings and repair cost profiles all matter. Color does not.
It depends on your vehicle value, your deductible choice and your location. For an older car with low market value, adding full physical damage coverage may cost more than the car is worth in a total loss scenario. For a newer financed vehicle, your lender will typically require both coverages.
Telematics programs use an app or device to track driving behavior including braking patterns, speed and phone use. Drivers with smooth, safe habits typically earn discounts. Aggressive driving can result in surcharges. If your driving habits are genuinely clean, opting in usually works in your favor.
Your rating territory changed. Urban areas have higher claims frequency, higher theft rates and higher repair costs than suburban or rural areas. Your insurer recalculates your territorial factor when your garaging address changes, which can produce a significant rate movement even if nothing else about your profile changed.
